
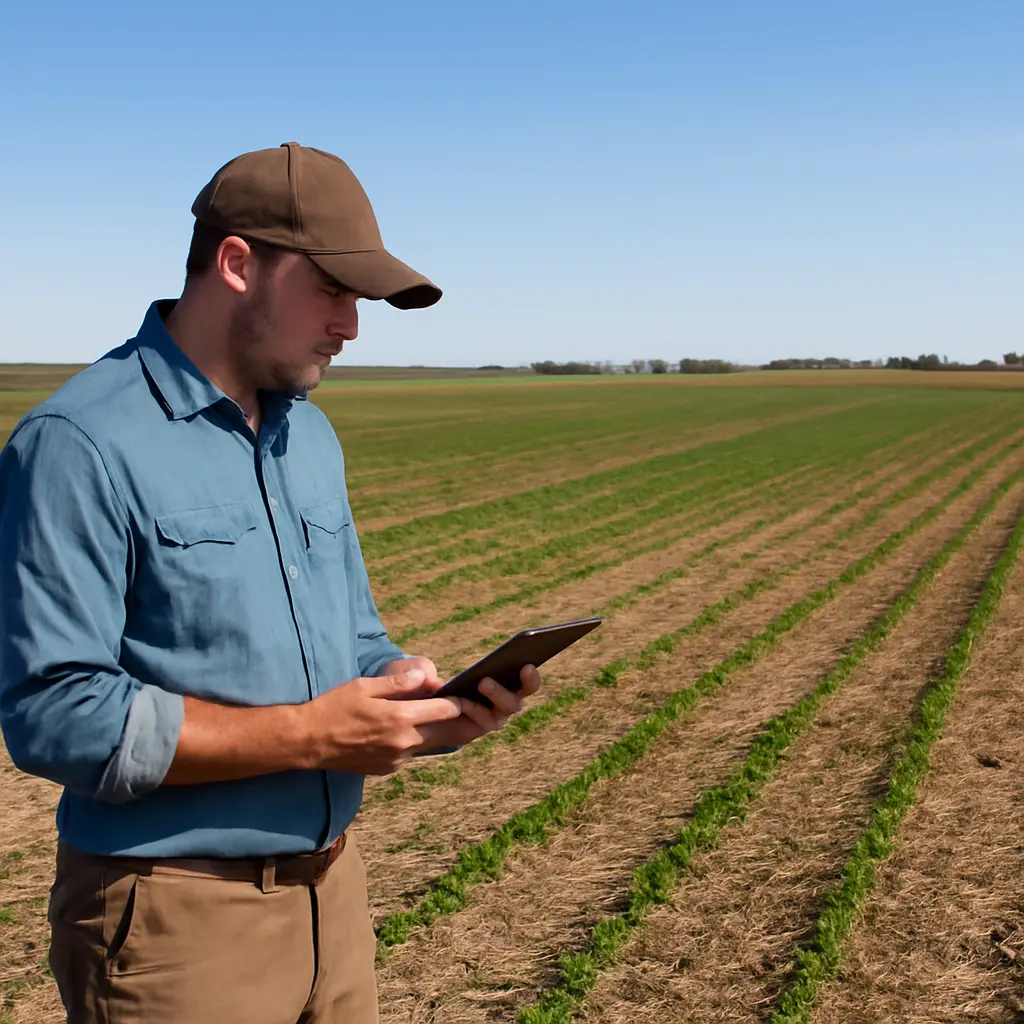
Ground cover percentage—the share of a field’s surface occupied by living plants, crop residue, or other cover—can reveal important differences that a yield chart alone cannot show. Yield records how much crop was harvested; ground cover helps explain what happened between planting and harvest, including soil protection, weed competition, water capture, and the performance of cover crops or conservation practices. USDA Natural Resources Conservation Service guidance emphasizes maintaining soil cover as a core soil-health principle, while field research shows that cover-crop effects on cash-crop yield vary with species, weather, and management. Reading cover percentages alongside yield therefore gives growers a fuller, more useful picture of field performance.
Ground cover percentage reveals what yield alone leaves out
Ground cover percentage is an estimate of how much of the soil surface is obscured by vegetation or residue at a specified place and time. It may describe living crop canopy, weeds, cover crops, or dead plant material, so a percentage is meaningful only when the observer states what was counted and when the measurement was made. A crop can produce a strong yield while leaving soil exposed early in the season; conversely, high cover does not guarantee high yield if the cover competes for water or nutrients.
That distinction matters because soil cover is linked to erosion control and the cycling of water and nutrients, whereas yield is an end-of-season production measure. NRCS identifies keeping the soil covered as one of its four principles of soil health. The practical story emerges by comparing cover through time with yield, rainfall, planting dates, and management—not by treating one percentage as a universal target.
Ground cover percentage measures soil protection and crop development
There is no single universal definition of a “good” ground-cover percentage. In field monitoring, it is commonly expressed as the proportion of points or image pixels classified as covered within a sampling area. The USDA Agricultural Research Service’s RUSLE2 framework treats cover and management as factors affecting soil loss, while NRCS soil-health materials describe residue and living cover as protection against raindrop impact, runoff, and erosion. These frameworks explain why cover is a management indicator, not a substitute for yield or a guarantee of a particular outcome.
The main categories are living crop canopy, cover-crop vegetation, weeds, and crop residue. Their effects differ: a dense cash-crop canopy can indicate vigorous crop development; a cover crop can protect soil between cash crops; weeds may also cover soil but compete with the crop; and residue shields the surface without actively taking up water. Separating these categories makes the percentage more informative.
Living crop canopy
Living crop canopy is the portion of the ground shaded or occupied by the crop’s leaves and stems. It can indicate stand establishment and canopy closure, but interpretation depends on growth stage: 40% cover shortly after emergence may be promising, while the same value near a crop’s peak canopy could signal uneven growth. Aerial imagery and field observations can help identify gaps, although canopy measurements should be checked against crop stage and field conditions.
Cover crops and living ground cover
Cover crops are plants grown primarily to protect or improve soil rather than to be harvested as the main cash crop. Their cover percentage can indicate establishment and the extent of living protection, but species, planting date, and termination timing matter. A synthesis by the Sustainable Agriculture Research and Education (SARE) program reports that cover-crop impacts on subsequent cash-crop yields vary across studies and management conditions; the result is not uniformly positive or negative. In dry regions or dry springs, a vigorous cover crop may use water that the following crop also needs, making termination timing particularly important.
Crop residue and nonliving cover
Crop residue is dead plant material left on the surface after harvest or tillage. Unlike living cover, residue generally does not compete with the crop for water, but its protective value depends on how evenly it is distributed and how quickly it decomposes. USDA conservation guidance identifies residue management as a way to reduce soil exposure; however, residue percentage alone does not describe soil structure, slope, rainfall intensity, or the condition of the soil beneath it.
Weed cover and unwanted competition
Weed cover is vegetation covering the soil that is not part of the intended crop or planned cover-crop stand. It may reduce bare ground while still lowering crop performance through competition for light, water, and nutrients. Thus, a high total-vegetation percentage can conceal a weak crop canopy. When possible, record crop, cover crop, weeds, residue, and bare soil separately rather than combining them into a single number.
Ground cover percentage explains patterns that yield charts miss
Yield charts summarize harvested output, but they rarely show whether production was achieved with protected soil, uniform crop establishment, or heavy weed pressure. Pairing yield with repeated cover observations can help distinguish those situations. The connection is especially useful when comparing fields, evaluating conservation practices, or diagnosing why yields differ despite similar fertilizer and seed plans.
Cover and erosion risk
Ground cover intercepts rainfall and reduces the amount of bare soil exposed to raindrop impact and runoff. The USDA Agricultural Research Service’s Revised Universal Soil Loss Equation, RUSLE2, incorporates cover-management conditions among the factors used to estimate sheet and rill erosion. A cover percentage is not itself an erosion prediction: slope, soil type, rainfall, tillage, and field length also influence risk. Still, low cover during erosive periods is a useful warning to investigate.
Cover and water availability
Residue can shade soil and slow evaporation, while living plants can both improve surface protection and consume water. The balance depends on species, biomass, climate, and termination date. This is why the same cover percentage can have different implications in a wet spring and a dry one. Farmers evaluating a cover crop should compare cover observations with soil moisture, rainfall, and the timing of termination rather than assuming that more living biomass always means more water for the next crop.
Cover and yield variability
Field-average yield can hide low-producing zones, just as a field-average cover estimate can hide bare patches or uneven establishment. Mapping both measures can show whether weak-yield areas coincide with poor crop cover, persistent weeds, wet spots, or other field conditions. A correlation does not prove that cover caused the yield difference, but it helps target soil tests, scouting, and follow-up measurements.
Ground cover percentage becomes useful when measurement is consistent
A percentage is only comparable when the method, sampling locations, timing, and cover categories are consistent. Visual estimates are quick but depend on observer judgment. Point-intercept methods record whether predetermined points land on cover or bare soil. Photo-based methods can estimate cover from images, while satellite and drone products can map larger areas but may confuse crop canopy, weeds, and residue under some conditions. Choose a method suited to the decision and verify remote estimates with field checks.
Set the measurement question first
Decide whether the goal is to assess soil protection, crop establishment, cover-crop performance, or weed pressure. Then define what counts as cover. For example, a soil-protection assessment may include both residue and living vegetation, while a crop-establishment assessment should distinguish the crop from weeds and residue.
Sample at repeatable times and locations
Record the date, crop stage, field location, and recent weather each time cover is measured. Use repeatable transects or georeferenced points, and take enough observations to represent field variability. A single photograph from a field edge is rarely representative of the whole field. Repeat measurements during key stages—such as after planting, before canopy closure, after harvest, and during cover-crop growth—to show change rather than a one-day snapshot.
Interpret the percentage alongside yield and management records
Compare cover maps or sample results with yield maps, planting and harvest dates, rainfall, soil characteristics, and management records. A simple chart can plot cover percentage over time alongside rainfall and crop stage; a field map can place yield and cover in separate panels using the same boundaries. These visual comparisons can identify questions for investigation, but they should not be treated as proof of cause without considering other factors.
Ground cover percentage guides practical field decisions
Consider two neighboring fields with similar harvested yields. One may have had strong residue cover after harvest and an evenly established cover crop; the other may have achieved the same yield while leaving large bare patches and relying on weed growth for much of its green cover. Yield alone makes them look alike. Separate cover measurements reveal different soil-protection and management conditions, prompting different next steps—such as adjusting residue distribution, revisiting cover-crop seeding, or controlling weeds.
A practical monitoring record can include:
- Field, date, crop stage, and measurement method.
- Percent crop canopy, cover-crop vegetation, weeds, residue, and bare soil, where feasible.
- Rainfall or soil-moisture context and relevant management operations.
- Yield by field or mapped zone, interpreted with soil and topographic differences.
- Notes on unusual conditions, such as ponding, drought stress, grazing, or uneven emergence.
The strongest use of ground-cover data is trend monitoring. A grower can compare the same field across seasons, test whether a management change improves establishment, and consult a local extension agronomist or NRCS conservation planner when erosion, water limitation, or measurement uncertainty is significant.
Conclusion: Ground cover percentage completes the yield story
Ground cover percentage adds context that harvested yield cannot provide by itself. Crop canopy, cover crops, weeds, and residue each tell a different part of the field’s story, and their significance changes with timing, weather, and management. Consistent measurements paired with yield, rainfall, and field records can help identify erosion concerns, explain uneven performance, and evaluate conservation practices. Track cover as a trend, keep its categories clear, and use the results to guide field checks and management decisions—not as a stand-alone score.
For further guidance, consult USDA NRCS soil-health and conservation resources, USDA Agricultural Research Service information on RUSLE2, and SARE’s cover-crop research and management materials.
Sources: USDA Natural Resources Conservation Service, Soil Health, https://www.nrcs.usda.gov/conservation-basics/natural-resource-concerns/soil/soil-health; USDA Agricultural Research Service, Revised Universal Soil Loss Equation, Version 2 (RUSLE2), https://www.ars.usda.gov/southeast-area/oxford-ms/national-sedimentation-laboratory/watershed-physical-processes-research/docs/revised-universal-soil-loss-equation-2-rusle2/; Sustainable Agriculture Research and Education, Managing Cover Crops Profitably, https://www.sare.org/resources/managing-cover-crops-profitably-3rd-edition/; Sustainable Agriculture Research and Education, Cover Crop Economics: Opportunities to Improve Your Bottom Line in Row Crops, https://www.sare.org/resources/cover-crop-economics-opportunities-to-improve-your-bottom-line-in-row-crops/.